Tired of Waiting for IT to Generate Your Reports? Try Ad Hoc Analysis
In midsize to large companies, it’s standard to have business intelligence (BI) analysts generate reports on behalf of employees.
Having a designated team is great, as it signifies you have the resources to process large volumes of data. However, it can be a roadblock to decision-making.
Generating a report can take several days and if your team is already receiving many requests, it can take their focus away from higher priority tasks.
This is where ad hoc analysis comes in handy – you can run your own queries as you need them.
Discover the benefits of generating your own reports and the tools that will help you do it.
Non-technical users – who may be unfamiliar with structured query language (SQL) – can use it to answer questions that require immediate answers.
With the ad hoc model, everyone is empowered to dig into the data and find exactly what they’re looking for, without having to go through someone else. Why is this helpful? It:
- Saves time – When everyone is able to run their own analysis, they don’t have to wait days or weeks for IT to get to it. It also allows your IT team to focus on top priorities without being distracted by one-off tasks.
- Speeds up the decision-making process – This also enables your team to make decisions quickly, as they can access data to support their decisions.
- Empowers your team – Democratizing access to data can help your team feel more invested in your projects and be equipped to share insights.
One potential downside of using ad hoc analysis is the risk of information silos, where team members are not sharing insights and making unilateral decisions.
When using the ad hoc model, it’s important to only focus on answering a specific question. You also want to use it for micro-level decisions, not large scale. Furthermore, share your insights with your team to get everyone on the same page.
Ad Hoc Example
You typically run ad hoc analysis as a response to an event.
For instance, let’s say your marketing team is wondering which channels to invest in for 2021. You could run a report to identify the channels that generate the most and least sales-qualified leads. You could also run a secondary report to identify where potential leads may be dropping off.
Ad hoc analysis is great when you want to:
- Validate a theory.
- Highlight specific data for an upcoming meeting.
- Make a decision quickly regarding an ongoing project.
Ad Hoc Reports
What is ad hoc reporting?
Ad hoc reporting is a one-time report that doesn’t require waiting for the standard analysis cycle. Typically, a report requires large volumes of data and follows specific templates to share with a large audience. With ad hoc reporting, you only pull a small segment of data for you or a small pool of users.
Wondering what’s the difference between ad hoc reporting and analysis? The former pulls the right data for the question you want to answer while the latter focuses on analyzing it for patterns, trends, and insights.
Standard (Canned) Reports vs. Ad Hoc Reports
Standard reports have limited customization options available, as they are usually created for large audiences and sent out on a regular schedule. They are created, managed, and distributed by technical IT users, with the end-user only being able to manipulate select data points.
Ad hoc reports, on the other hand, are much more flexible. Non-technical users can dig through data, pull out what they want and how they want to display it whenever they need it.
In addition, ad hoc reports can be more visual than standard reports, which tend to follow set templates for easy distribution.
Ad Hoc Reporting Tools
When searching for a business intelligence (BI) reporting tool, here are some key features you’ll want to look for:
- Data visualization
- Easy sharing options
- Access to multiple data sources
- Integrations
Here are some top ad hoc analysis and reporting tools available online today.
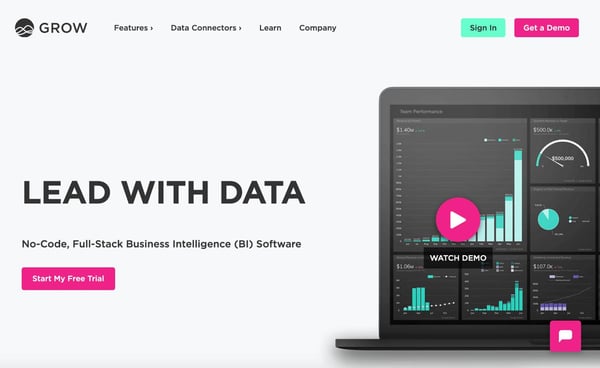
1. Grow
Grow is a business intelligence tool that centralizes your data and offers no-code solutions. No need to host your marketing data on one platform and your financial data on another. Grow’s powerful integration software removes the need for third-party data warehouses.
You can easily integrate your data from multiple sources, including:
- CRMs like HubSpot
- Social media platforms like Instagram and LinkedIn
- Ecommerce sites like Shopify
- Payment processors like Square and Stripe
- Ad platforms like AdRoll and Google Ads
- Financial institutions like Chase and Bank of America
The user-friendly dashboard and visualization capabilities, you can quickly get answers to your most pressing questions. For pricing information, contact the company.
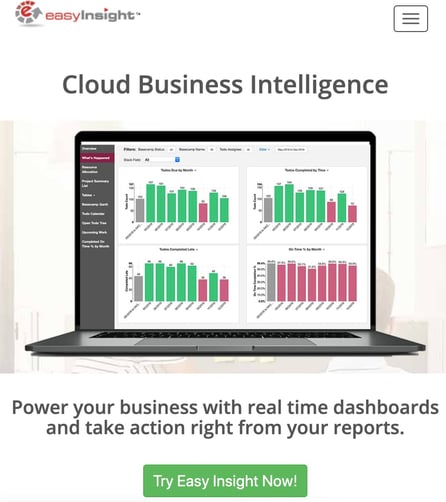
2. Easy Insight

Easy Insight is another code-free business intelligence tool that enables non-technical users to run ad hoc reports in a few simple steps.
Whenever you need it, you can create custom reports using a range of filters and visualize them through tables, charts, and a host of other visualization tools.
The platform is highly customizable, allowing you to create your own data sources, import data from other databases, and combine your data for unified reporting. It also integrates with HubSpot to help you leverage your insights to make decisions.
Easy Insight offers six plans for small to large companies. Pricing ranges from $29/month to $1499/month.
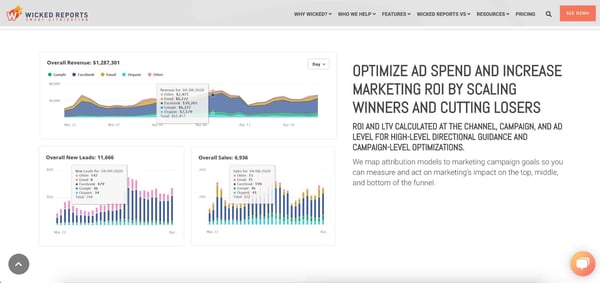
3. Wicked Reports
If your team is currently relying on several platforms to gather and analyze data, then consider Wicked Reports. This tool caters specifically to marketers looking to step up their data analytics game.
Wicked Reports helps teams track return on investment (ROI) on various campaigns and improve their customer lifetime value. With the easy-to-use dashboard, any user can run ad hoc reports to assess performance against goals and make quick decisions.
The best part? You don’t need IT to set it up or use it. The platform is accessible to non-technical users who want clean and accurate data.
Starting at $597/month, Wicked Reports is ideal for scaling businesses looking for a reliable analytics tool.
With ad hoc analysis, you can empower your team to easily access the data they need most, freeing up your IT staff in the process.
![]()
![→ Free Download: Free Marketing Reporting Templates [Access Now]](https://no-cache.hubspot.com/cta/default/53/0d883e85-c2e5-49bb-bef2-bfddb500d84b.png)

